Turning disruption history into route risk scores
Risk calculator · Dataset · Practitioner tool | Work Packages 1 & 3
Introduction
Knowing that a particular border crossing is ‘prone to delays’ is not useful for routing decisions. Knowing that it experiences an average of two significant disruptions per year, with a strong peak in winter months, and that road alternatives exist but add 18 hours to journey time — that is. The Disruptions Module (DEM) converts fragmented historical disruption event data into concrete, seasonally-adjusted risk scores for specific nodes and corridors across European multimodal freight networks. It provides the disruption intelligence layer that the ReMuNet platform needs to make its resilience claims credible, and it does so in a form that logistics operators and platform developers can actually use.
Context
Disruption data exists in abundance — scattered across news archives, transport authority bulletins, logistics trade press, and operator logs. But it is fragmented, inconsistently coded, and not in a form that a routing platform can use. No consolidated, open dataset of disruption events and their operational characteristics existed for the European multimodal freight network before this work.
The gap matters for practical and credibility reasons alike. Practically: a platform that recommends rerouting around disruptions needs to know where disruptions are actually likely, how severe they typically are, and whether risk varies by season, mode, or corridor. Without that, alternative route recommendations may steer freight towards corridors that are statistically more disruption-prone than the ones being avoided. For credibility: a resilience platform without disruption intelligence is difficult to validate. The DEM was developed specifically to address both problems — and to do so in a way that remains useful even when historical data is limited, as it often is for newer corridors or emerging disruption types.
The tool sits at the intersection of Work Packages 1 and 3 in ReMuNet: building on the disruption typology developed in WP1 (ER2) and feeding directly into the platform’s routing engine in WP3.
About Hanken School of Economics
Hanken School of Economics led Work Package 1 of ReMuNet and contributed to Work Package 3, providing the qualitative and empirical foundations for the platform’s disruption intelligence capabilities. Hanken’s HUMLOG Institute brings expertise in supply chain risk, humanitarian logistics, and transport network resilience. The DEM was developed by Hanken as a proof-of-concept tool bridging the qualitative disruption research of WP1 with the quantitative modelling needs of the platform — and it was designed from the outset to be platform-agnostic and reusable beyond the ReMuNet context.
Challenge addressed
- Data scarcity and fragmentation: disruption records are scattered across incompatible sources with no shared coding scheme, making aggregation and analysis extremely difficult.
- Qualitative-to-quantitative gap: the rich qualitative understanding of disruption dynamics developed in ER2 needed to be converted into numerical risk estimates usable by routing algorithms — a translation that requires both methodological care and transparency.
- Seasonal and corridor-specific variation: disruption risk is not uniform. Rhine droughts are a summer phenomenon; winter road closures are a seasonal regularity; border congestion at specific crossings is a structural feature. Generic risk estimates flatten these differences and produce misleading outputs.
- Small-dataset robustness: many corridors have short or incomplete event histories. The tool needed to produce credible risk assessments under data scarcity, not just for well-documented cases.
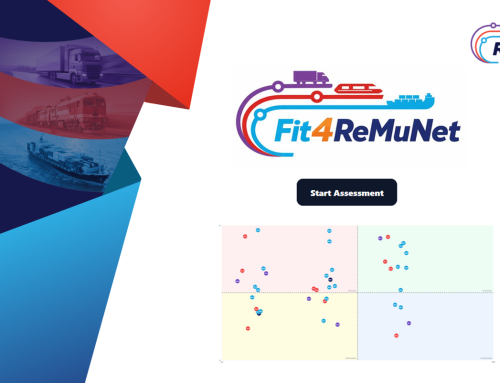
- Practitioner accessibility: even well-constructed risk models go unused if their outputs are opaque. The tool needed to surface risk in a format meaningful to logistics operators, not just researchers.
Solution
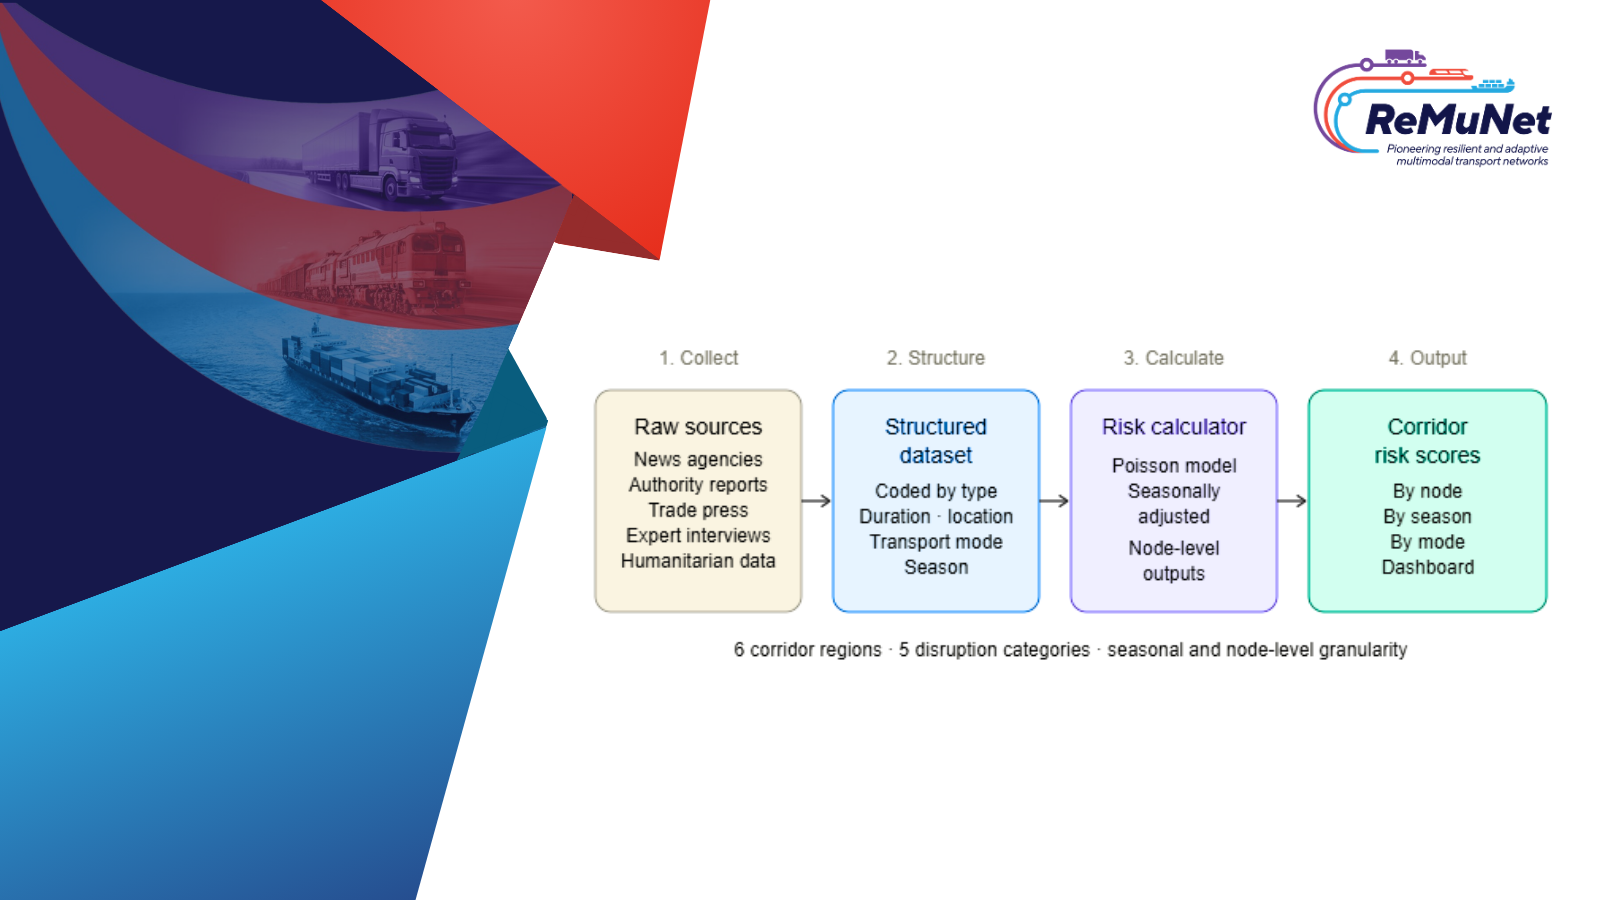
The DEM consists of two integrated components:
Unified disruption dataset. A structured dataset compiled from systematic document analysis — national news agencies, transport authority publications, logistics trade press, and humanitarian cluster reports — covering disruption events across six European freight corridor regions. Every event was coded according to the ER2 typology: disruption type, duration, geographic extent, affected transport nodes and modes, and seasonal timing. Expert interviews validated the dataset and filled gaps where published sources were thin. For the Baltic–Ukraine corridor (developed for the WP5 humanitarian pilot), a fifth disruption category was added: conflict and border disruption, covering events such as agricultural protest blockades, conscription-driven staffing shortages at crossing facilities, and security-related access restrictions.
Risk calculator and dashboard. A Poisson-based model translates the event history into seasonally-adjusted, corridor-specific disruption risk scores at the node and route-segment level. Poisson distribution is appropriate for count data (number of disruption events per unit time) and handles small datasets robustly. The outputs are surfaced through a practitioner-facing dashboard showing where risk is highest, how it varies across the year, and how it compares across transport modes for a given corridor. The calculator is updatable as new event data becomes available.
Outcomes and next steps
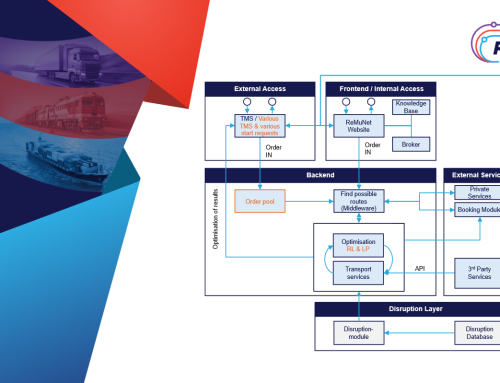
- The DEM is integrated into the ReMuNet platform demo, providing the disruption intelligence layer that allows the routing engine to weigh disruption probability alongside cost and time.
- As an openly published proof-of-concept, it provides a reusable template for disruption risk assessment in other multimodal corridor contexts across Europe.
- The Baltic–Ukraine corridor extension (ER16) demonstrates the tool’s performance in an extreme operational environment with sparse historical data.
- Future development: real-time data feed integration, extension to additional corridors, and machine learning approaches to improve calibration as the dataset grows.
Name Position Organisation Email Ketki Kulkarni Postdoctoral Researcher Hanken School of Economics [email protected]
From Disruption Data to Actionable Risk Scores
Transforming fragmented historical disruption data into practical, corridor-specific risk intelligence for multimodal freight routing.
Building Smarter and More Resilient Routing Decisions
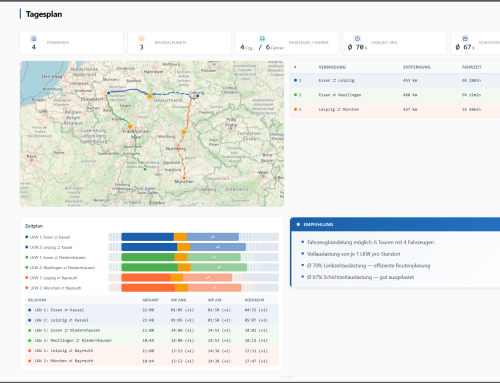
Developing a risk calculator that helps identify disruption-prone nodes, seasonal vulnerabilities, and safer alternative transport routes.
Strengthening ReMuNet’s Disruption Intelligence Layer
Integrating disruption risk analysis into the ReMuNet platform to support more reliable, adaptive, and data-driven freight planning.
 Funded by the European Union under GA number 101104072. Views and opinions expressed are however those of the author(s) only and do not necessarily reflect those of the European Union or the European Climate, Infrastructure and Environment Executive Agency (CINEA). Neither the European Union nor the granting authority can be held responsible for them.